
Quantitative Assesment for Measurable Progress
Our methodology helps you achieve software excellence through comprehensive evaluation of your software development effectiveness
What is the Effectiveness Index?
The BetterSoftware Effectiveness Index is a standardized objective metric of productivity and code quality.
Based on a universal model, derived from the biggest database of software improvement plans, each team undergoes an initial evaluation of key competencies across the full software development lifecycle.
It provides a clear, structured assessment and assigns grades from A4 to G, indicating the team’s proficiency and implementation of key practices.
It’s a roadmap for continuous improvement that help teams set clear goals, and define specific, actionable objectives to elevate their performance.
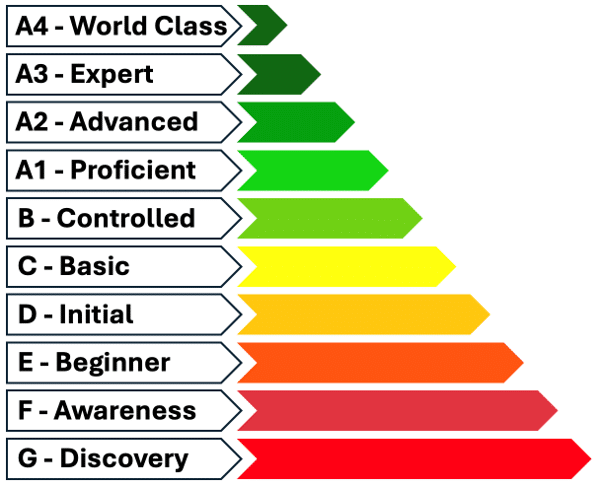
Achieving a level of mastery that sets them apart in the industry, your team has developed unique applications that give your organization a competitive advantage. These practices drive higher quality, increased customer satisfaction, and higher levels of motivation among developers.
Similar to the A2 level with the addition that the team is considered a source of excellence for the specific competency across its own company. Other teams are actively copying their best practices
Similar to the A1 level with the addition that the team is actively researching new technologies and methodologies to enhance their usage of the competency
Similar to the B level with the addition that secondary KPIs are used for the competency, attempting to extract all possible benefits from the competency. Some KPIs trending up over time and some are flat
Knowledge of competency exists, something is done regularly. Using the primary KPIs, trending exists and is either flat or improving consistently. Cadence of measuring and preventing is high. Most or all Issues are fixed as close as possible to the moment when they happen
Knowledge of competency exists, something is done regularly and no longer sporadic. Using the primary KPIs, trending exists and is flat. Cadence of measuring and preventing is still slow. Issues are fixed sometimes when they happen and sometimes at a later phase
Knowledge of competency exists, something is done, irregular and still sporadic execution. Starting to use the primary KPIs, no consistent trending
Knowledge of competency exists, something is done, irregular, no tracking and very sporadic execution. Perhaps, once in a release check
Knowledge of competency exists, but mostly nothing is done, there may be someone in the team who can speak about intentions or planning
Knowledge of competency does not exist, the team does not know it or does not believe it is best practice, or believes it is not relevant to them
The Role of the Effectiveness Index in Achieving Excellence
The BetterSoftware Framework helps you achieve excellence with data-driven insights based on a proven methodology. Through a comprehensive evaluation against industry benchmarks, we create a personalized improvement plan to guide your team to success.
Fix Defects at the Source
Catch software bugs as soon as they arise to save resources and prevent costly delays during formal testing. Staying ahead by resolving problems early in development, ensures your product meets quality standards and deadlines.
Understand the True Cost of Issues
Reduce costs and ensure smoother operations by minimizing time between issue introduction and detection. By addressing issues early, teams can avoid delays, maintain project momentum, and deliver high-quality products on time.
Quantify Customer Satisfaction
Maximize customer satisfaction by minimizing escalations and reported issues. Prioritize proactive measures to address potential problems early, ensuring smoother operations and happier customers, and a reputation for delivering high-quality products.
Drive Continuous Improvement
Stay proactive in monitoring and improving your software development process. Regularly review and refine your processes to identify and resolve potential issues before they impact your projects to improve the quality of your products and team efficiency.
Continuous Effectiveness Monitoring
We continuously monitor progress, adjust the improvement plan as needed, and ensure your processes evolve to maintain peak performance.
